open to winter 2026 & summer 2027 internships · Charlotte, NC

Marks Guo.

currently thinking about

Hi, I'm Marks, a Statistics & Finance student at the University of Rochester. I like data analytics, statistical modeling, and quantitative risk. I also really like to answer problems and find patterns.

0.00 GPA / 4.00
0 daily returns modeled
0 FRED series in pipeline
0 languages spoken
/ 01

# about

I'm a junior at the University of Rochester pursuing a double major in Statistics and Finance, with a Certificate in Actuarial Studies in progress and a place on the Dean's List every semester.

A lot of what I do sits between quantitative methods and capital markets, so Bayesian inference, regression diagnostics, and financial statement analysis. I also really care about making sure the models I build are credible and can actually be trusted.

I've been really into running my own research projects lately. From raw FRED pulls and PostgreSQL schemas, through diagnostics and convergence checks, to published Tableau dashboards and equity research write-ups. The boring stuff is half the work, but it's also where most analyses quietly go wrong.

/ currently
  • exploring new agentic AI tools
  • analyzing different types of Expected Shortfall in the market
  • extending SPY volatility work into a GARCH(1,1) baseline
  • shipping the live Beyond U-3 labor dashboard
/ 02

# about me

Some stuff about me outside of my work

/ home

Where I'm from

I was born in Brooklyn, NY, but spent my first 5 years growing up in Fuzhou, a city in China's Fujian province, where my parents are from. However, we came back to the states and I grew up in Charlotte, NC, until I left for College at the University of Rochester.
/ controller

What I'm playing

What I play when I need to turn my brain off: Washington Post Crosswords, NYT Wordle, Clash Royale (Ultimate Champion), LOL: Wild Rift (Grandmaster), and Teamfight Tactics (Set 15 peak Challenger). Also recently been into competitive Pokemon, since I collected cards as a kid.

/ ears

What I'm listening to

I listen to a lot of indie, rock, rap, pop, alternative, rnb, etc. Here's everything because I am not a playlist person: Marks's Playlist. If you have any music recommendations, I am always (and I mean genuinely always) interested!

/ outside work

What I'm into

Exploring new music genres, keeping up with AI news and new AI tools, and math (originally wanted to be a math major!). I'm also picking back up piano and drawing, things I did as a kid that I dropped along the way.

/ side quests

If I had infinite time

I wan't to explore and travel to a bunch of different countries and embracing the culture. In middle school, I went on a trip sponsored by Education First to Costa Rica, and that is one of my most eye-opening and enjoyable experiences I have ever been on.

/ random

A small fact about me

My birthday (7/16), my older brother's (7/13), and my dad's (7/14) are all in the same week. As a kid, we used to go to IHOP on all three days because I really liked their hashbrowns, so now IHOP is my comfort food.

/ 03

# selected work

All independent projects. I did the full pipeline, code, and write-up on each one.

01 / frtb

FRTB IMA Risk Monitor

Python PostgreSQL Plotly Dash Docker CI/CD Claude API

May 2026 to now

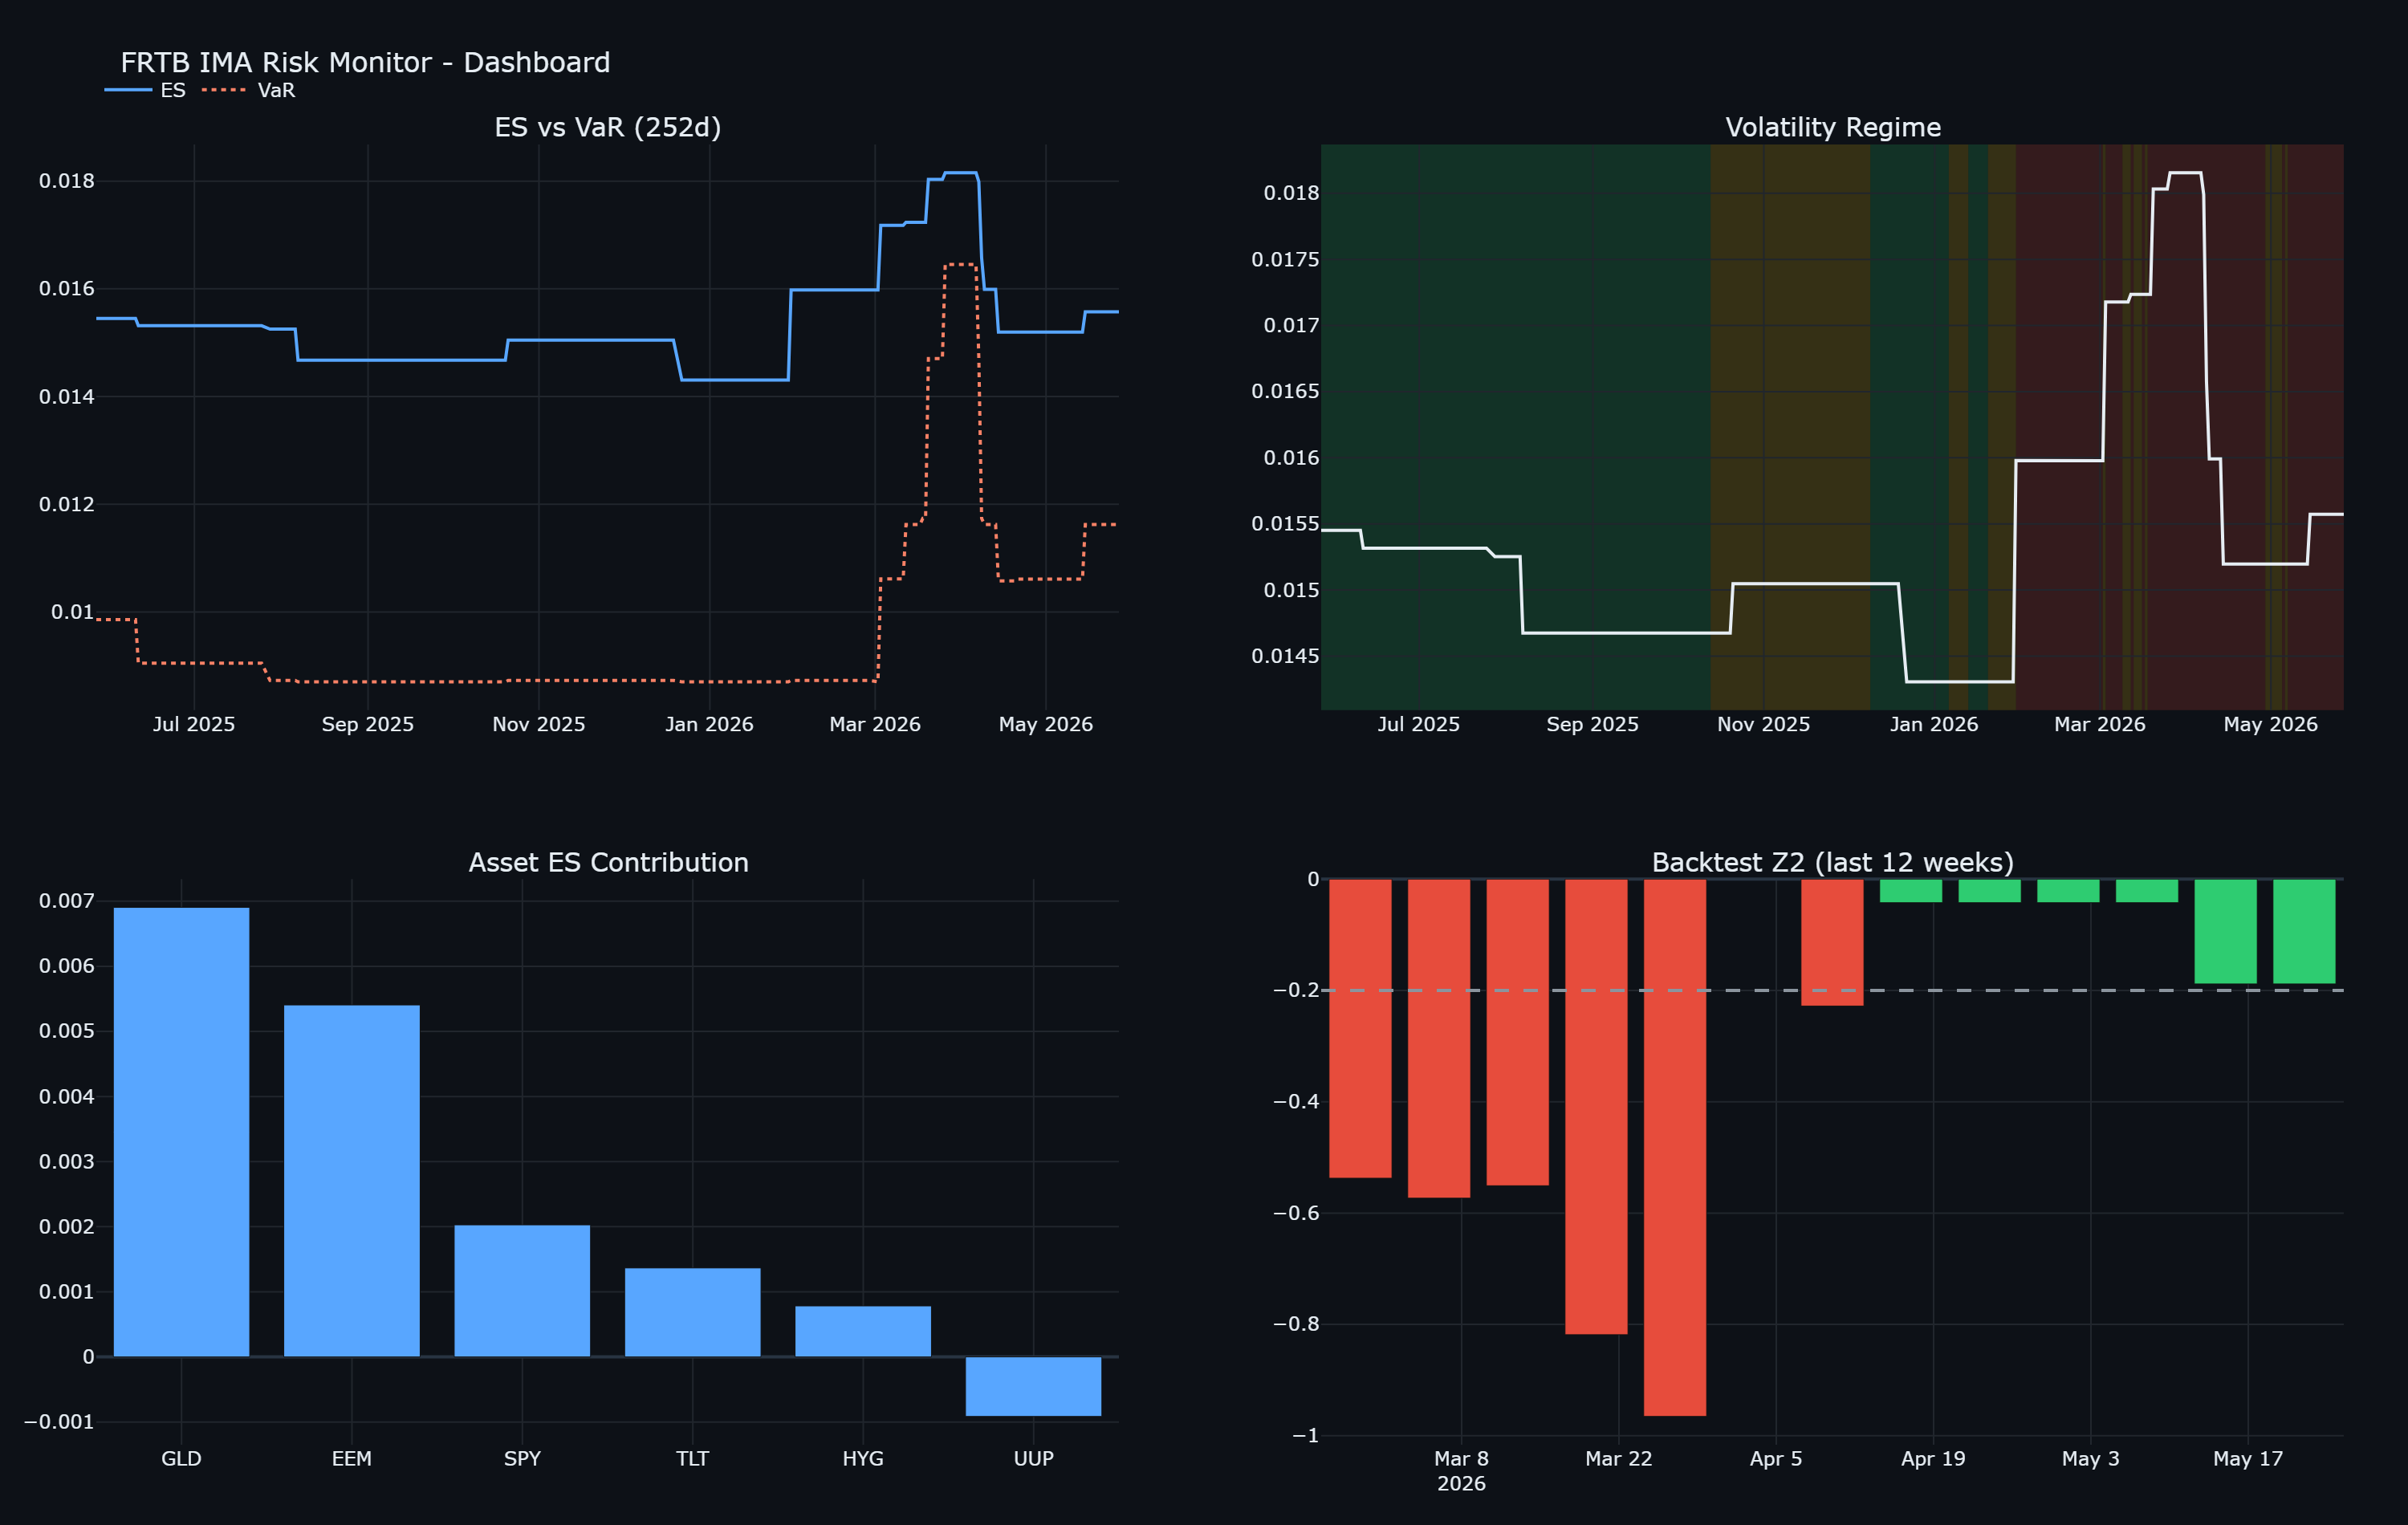
This is the biggest thing I've built. It's an automated risk system that computes Basel III FRTB Internal-Models-Approach capital on a multi-asset book: Value at Risk, Expected Shortfall, stress calibration, and a Standardised-Approach comparison. It all runs on its own and feeds a live dashboard that's actually deployed.

  • 97.5% Historical-Simulation VaR & Expected Shortfall (with parametric & Monte-Carlo Student-t comparisons), stress-calibrated and liquidity-horizon-adjusted, across a 6-asset book (29,000+ daily obs, 2007-26).
  • Computes an Internal-Models vs Standardised-Approach capital charge under the Basel III output floor. Right now the SA floor binds at 11.2% of notional.
  • Weekly Acerbi-Szekely ES backtest with Kupiec & Christoffersen tests; surfaced a 54%-of-weeks failure rate revealing the procyclicality of rolling-window ES.
  • Built it end to end: pytest + GitHub Actions CI, a Dockerized stack, and a daily cloud run (Actions cron) whose event detector flags regime shifts, ES spikes, and backtest breaches, then auto-publishes Claude-written risk-desk recaps with rendered risk cards.
  • I built it by directing Claude Code (an agentic AI tool), and I hand-checked every risk function against my own results as the human in the loop.
ES 97.5% 1.56% liq-adj 3.36%
capital 11.2% SA floor binds
backtest 54% weeks fail
history 29k+ obs · 2007-26
FRTB risk dashboard: ES vs VaR, volatility regime, per-asset risk contribution, and weekly backtest
Reading the four panels:
  • ES vs VaR: average tail-day loss vs the loss threshold, over 252 days.
  • Volatility regime: shaded background, green calm, amber elevated, red stressed.
  • Asset contribution: which holding drives today's potential bad-day loss.
  • Backtest (Z2): weekly model check, green passes, red underestimates risk.
02 / labor

Beyond U-3: Labor Market Dashboard

Python PostgreSQL SQL Tableau FRED API SQLAlchemy

May 2026 to now

An automated macro dashboard that shows how much the official U-3 unemployment rate understates real labor market stress, and tracks the leading indicators that actually call turning points.

  • Designed a normalized PostgreSQL database storing 14 FRED time series across 30+ years of U.S. labor data.
  • Quantified U-3 understates labor stress by 4.42 pts in normal periods, 5.37 pts in the Great Recession.
  • Built a Python pipeline (FRED + pandas + SQLAlchemy) resampling mixed-frequency series and computing derived metrics live.
  • Scheduled monthly through Windows Task Scheduler, so it's a production database with zero manual refresh.
  • Tracks 8 leading indicators including temp help (−21.4% from peak), quits rate, 10Y-2Y spread, and saving rate.
snapshot · apr 2026 ● live
U-3 4.3%
U-6 8.2%
temp.helps −21.4%
yield 10y−2y +0.52%
saving rate 3.6%
prime LFPR 83.8%
03 / risk

S&P 500 Volatility Prediction

Python R OLS WLS Robust M-Est.

Jan to May 2026

I built and compared three regression families on 4,800+ daily S&P 500 returns (2007-2026) to predict realized volatility and measure how much risk persists. That persistence question is what sits under any dynamic VaR model.

  • Confirmed statistically significant volatility clustering (p < 0.0001); directly supports dynamic VaR and portfolio risk frameworks used in industry.
  • Validated on a 70/30 train-test split with a full diagnostic suite: heteroscedasticity testing, ACF analysis, and Cook's distance for influence.
  • Compared OLS, WLS, and Robust M-estimation to see which assumptions actually hold once you stop pretending returns are i.i.d. normal.
n 4,800+ daily returns
window 2007-26 19 yrs · 2 regimes
clustering p<.0001 significant
split 70 / 30 train / test
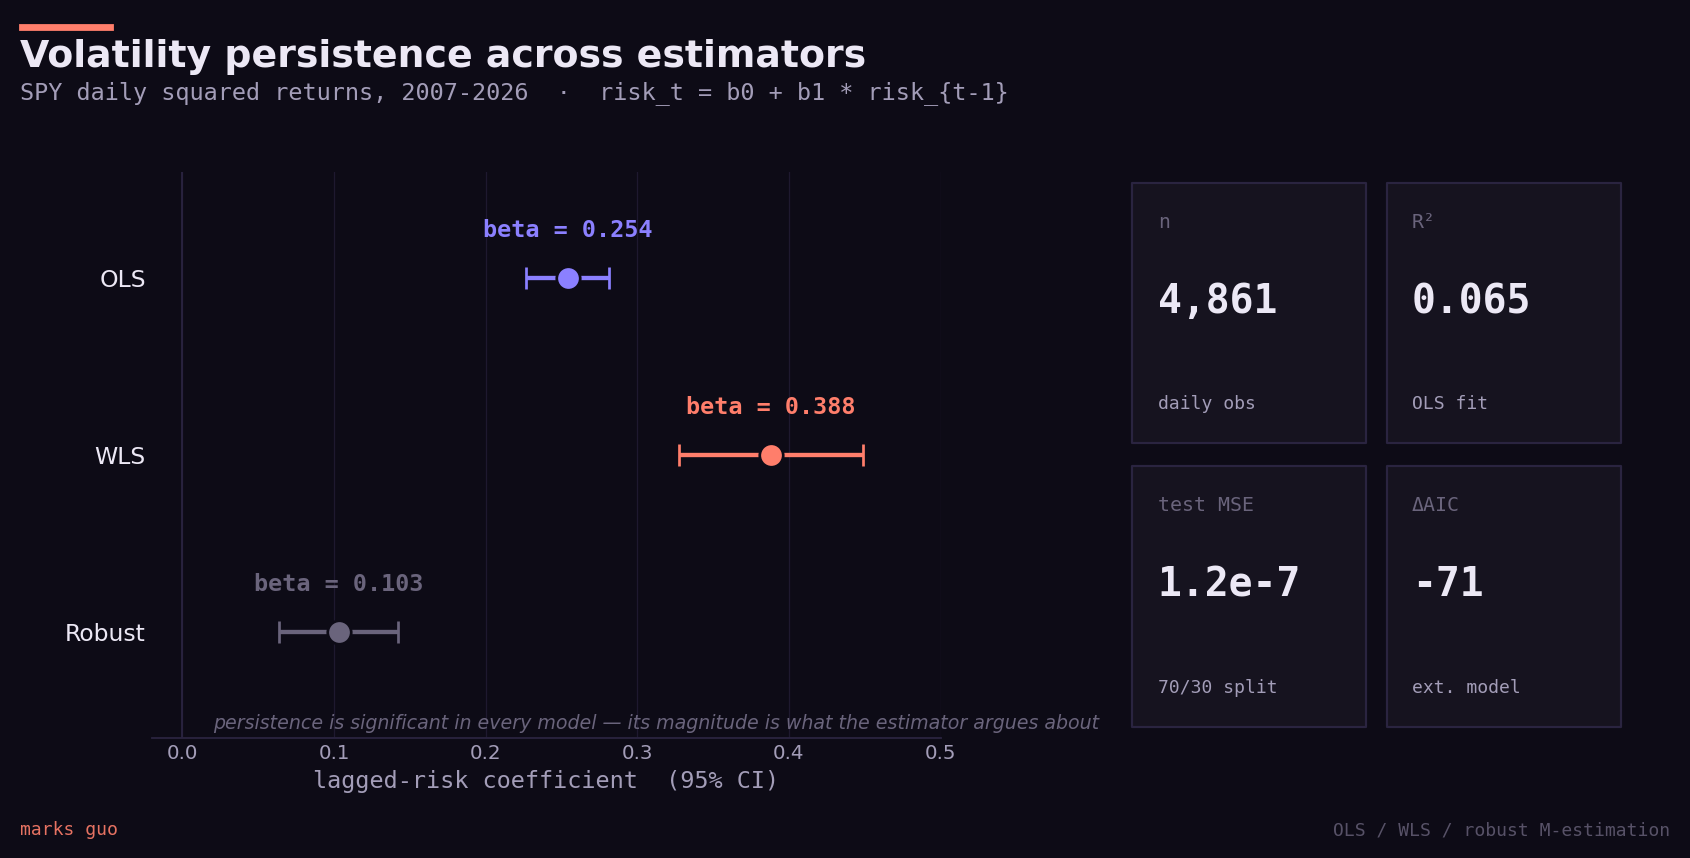
Lagged-risk coefficient across OLS, WLS, and robust M-estimation with 95% confidence intervals, plus fit statistics
Persistence, three ways. The lagged-risk coefficient stays significant under every estimator. WLS lifts it to 0.39 once you correct for heteroscedasticity, and robust M-estimation trims it to 0.10 once you downweight the outliers.
04 / inference

Bayesian Hierarchical Modeling

R Metropolis-Hastings MCMC Diagnostics

Sep 2025 to Mar 2026

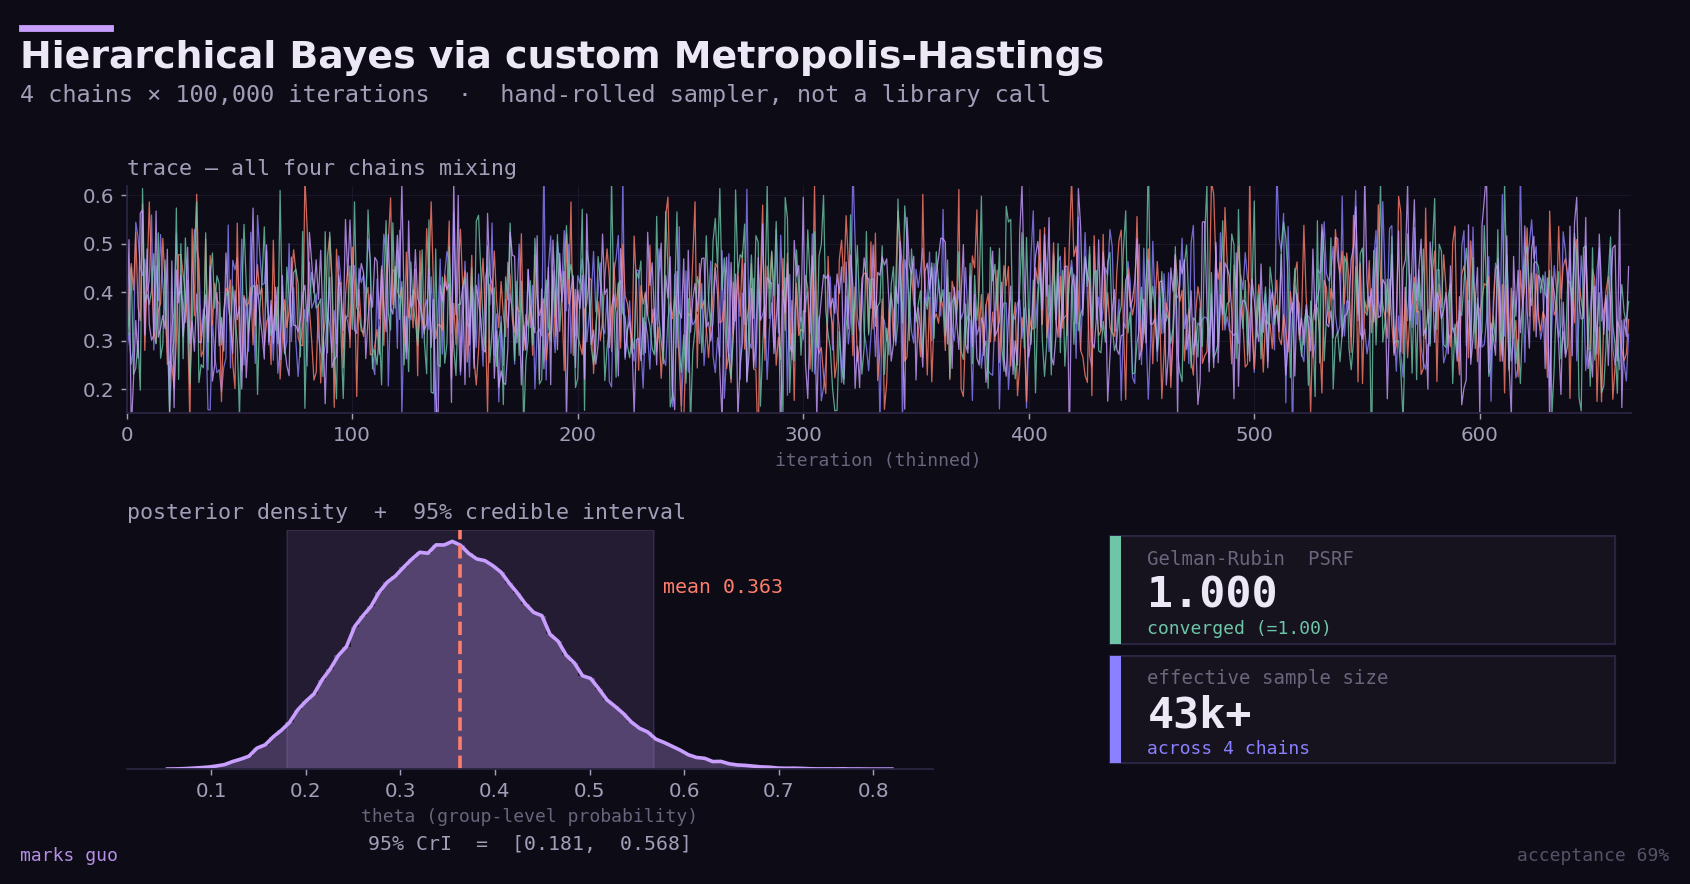
I wrote a hierarchical Bayesian model from scratch, including a custom Metropolis-Hastings sampler I coded myself instead of calling a library, to estimate group-level probabilities and put real numbers on the uncertainty.

  • Ran 4 Markov chains × 100,000 iterations each; tuned proposal step sizes for healthy acceptance rates.
  • Confirmed convergence via Gelman-Rubin diagnostics (PSRF = 1.0); effective sample sizes exceeding 26,000 across all chains.
  • Reported everything with 95% credible intervals and turned it into plain recommendations someone non-technical could actually use.
chains 4 parallel
iter / chain 100k incl. burn-in
PSRF 1.0 converged
ESS 26k+ all chains
Four Metropolis-Hastings chains mixing, the resulting posterior density with 95% credible interval, and convergence diagnostics
Actual convergence. Four chains from spread-out starts all settle onto the same posterior, Gelman-Rubin lands at 1.00, and there are tens of thousands of effective samples. I wrote the sampler by hand, so every diagnostic is earned.
05 / valuation

Amazon, Inc. DCF & Equity Valuation

Excel DCF CAPM / WACC Sensitivity

Jan to Apr 2025

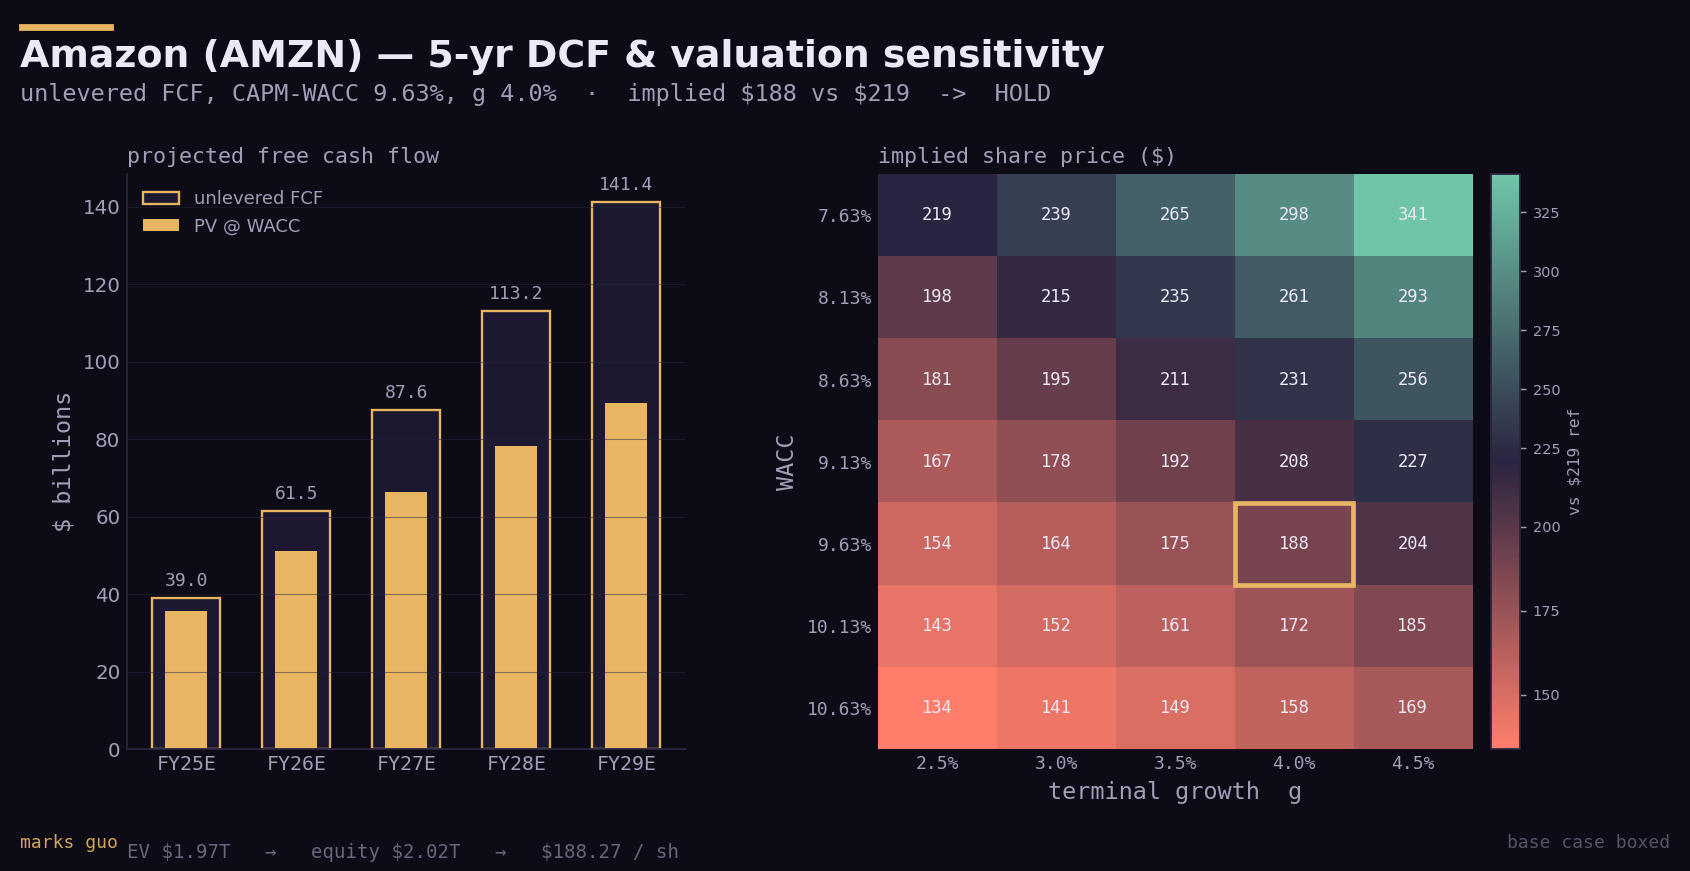
I built a 5-year pro forma model and a DCF valuation with a CAPM-derived WACC, then ran it across a few macro scenarios and stress-tested beta, WACC, and terminal growth in sensitivity tables. It ends in a full equity research report with a “Hold” I can actually defend.

  • Trend, common-size, and ratio analysis across profitability, liquidity, leverage, and default risk.
  • Scenario-conditional WACC and terminal growth bands so the call holds up no matter which macro assumption you believe.
Amazon five-year unlevered free cash flow projection with present values, and a WACC-by-terminal-growth sensitivity heatmap of implied share price
Where the Hold comes from. Discounting five years of unlevered FCF plus a Gordon terminal value gives an implied $188 against the $219 reference. The heatmap shows how fast that flips across WACC and terminal growth, and the base case is boxed.
06 / research

University Endowment & Resource Allocation

Excel NACUBO IPEDS Faculty Research

Feb to Apr 2024

Research I did with Prof. Michael Rizzo across 11 universities. We found a significant correlation between endowment-per-student and U.S. News rankings, and I presented it to Economics faculty with data-backed conclusions about how schools trade off where their resources go.

/ 04

# in progress

Automated systems I run every day and keep improving. All live, and all mine.

live / market-radar

Market Radar

Python Gemini API RSS + EDGAR 13F GitHub Actions Paper Portfolio

live

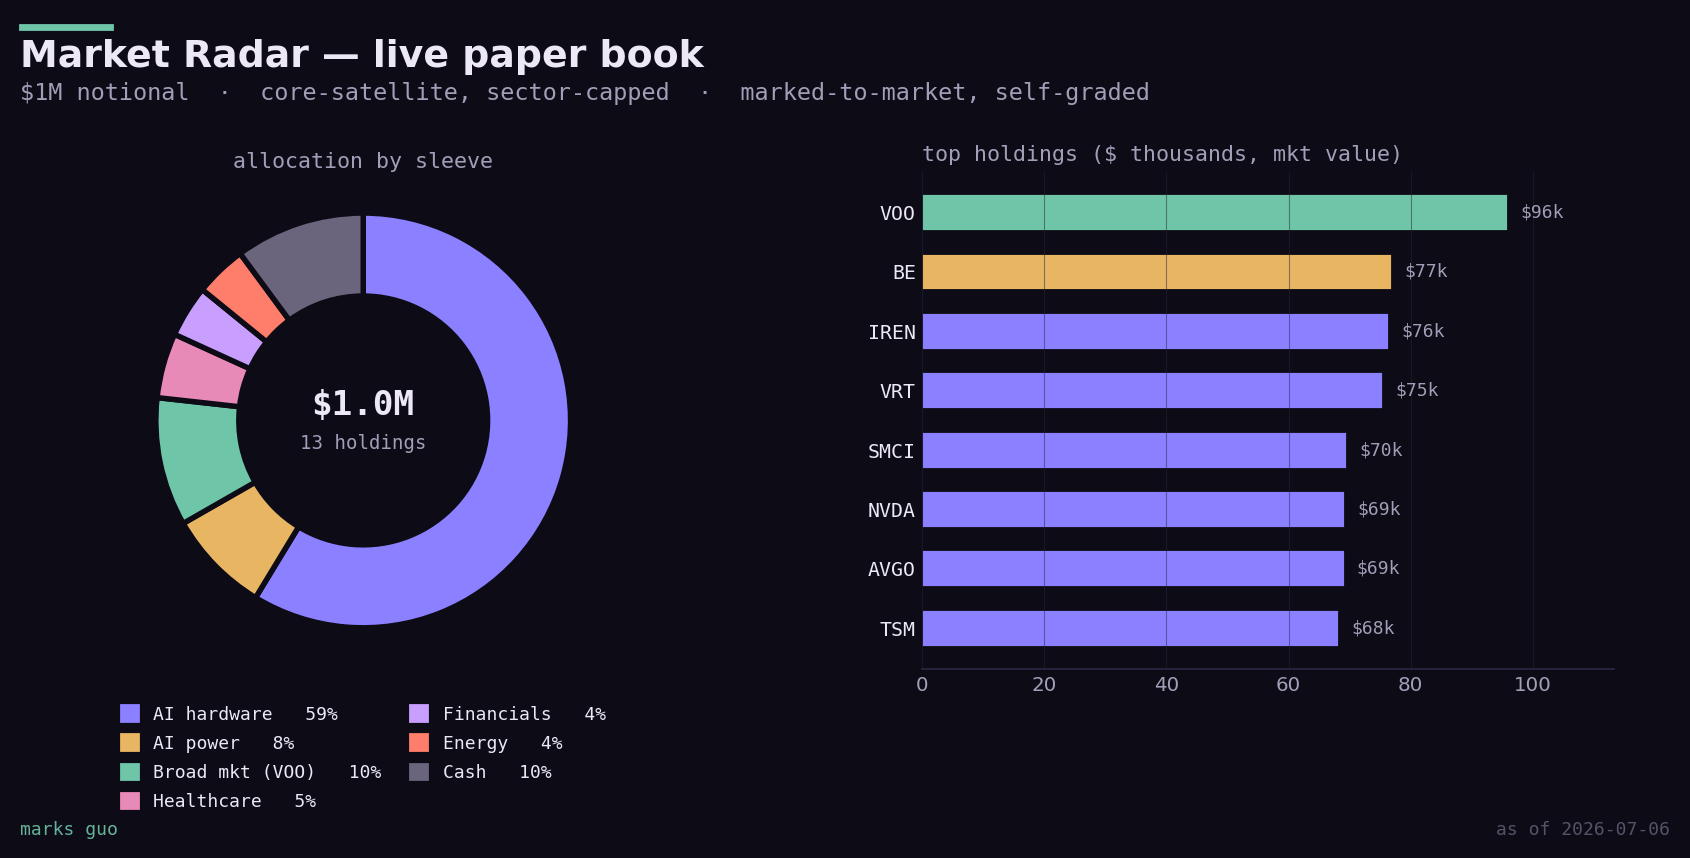
An automated research desk that reads the market every day. It pulls market-moving news and 13F filings, has an LLM score the first- and second-order stock impact, and sizes a conviction-weighted $1M paper book under real risk controls. Then it grades its own calls against sector benchmarks and feeds what it learns back into a weekly loop.

  • Ingests CNBC / MarketWatch / Google News plus EDGAR 13F filings from 16 marquee investors, scores relevance, and analyzes the top names on a paced daily schedule.
  • Sizes a core-satellite book with per-name and per-sector caps, volatility tilting, and a lateness gate so it can't chase a move that already happened.
  • Relative-return grading: every call is scored on whether it beat its sector ETF, not just the tape. Beating your sector is the only thing that actually makes alpha.
  • Runs unattended on GitHub Actions, emails a ranked report twice a day, and rebalances the paper book weekly.
Market Radar live paper book: allocation by sleeve donut and top holdings by market value
The live book. A sector-capped $1M paper portfolio, marked to market and graded against itself. The AI-hardware names are capped around 60%, and a fixed sleeve of VOO, XLV, XLF, and XLE keeps the whole thing from turning into a single-theme bet.
live / intern-tracker

Internship Tracker

Every morning at 8AM it scans 50 firms' career pages for new Summer 2027 quant & finance postings and emails me only the diffs, so I never miss a drop and never have to scroll a careers page by hand.

Python · GitHub Actions · cron · SMTP

live / ai-radar

AI Radar

A daily ~7AM digest of new agentic tools and AI-dev news, pulled together by an LLM into a ranked email. It's how I keep up with a field that moves faster than any newsletter can.

Python · Gemini · GitHub Actions

/ 05

# stack & methods

Languages & tools

  • Python
  • R
  • SQL
  • PostgreSQL
  • Excel (advanced)
  • Tableau
  • Power BI
  • pandas
  • SQLAlchemy
  • FRED API

Quant & statistics

  • Regression Modeling
  • Bayesian / MCMC
  • Monte Carlo
  • Time Series
  • Heteroscedasticity Diagnostics
  • Hypothesis Testing

Finance

  • Financial Modeling
  • DCF / WACC / CAPM
  • Sensitivity Analysis
  • Equity Research
  • Financial Statement Analysis
  • Risk Management

Languages spoken

  • English
  • Mandarin
  • Cantonese
  • Fuzhounese

Relevant coursework

Statistical Methodology · Financial Statement Analysis · Investments · Statistical Computing in R · Financial Management · Accounting · Corporate Finance

/ 06

# experience

China Fun of NC, Inc.

Junior Financial & Operations Analyst

Sep 2017 to Jul 2025 Charlotte, NC
  • Drove 25% revenue growth (~$375K incremental annually) at a $1.5M+ revenue operation via margin expansion and data-driven process improvements across procurement, fulfillment, and labor.
  • Monitored food cost ratios against a ~32% COGS target; identified $10K+ in annual ingredient savings through vendor renegotiation and waste reduction across $30K+ in monthly procurement.
  • Built a 2,000-cell Excel order & financial tracking system integrated with DoorDash, reconciling $125K+ in monthly revenue across 150+ daily orders.
  • Prepared monthly P&L summaries (revenue, ~28% labor, food cost) and presented to ownership to support operational and budgetary decisions.
  • Reconciled daily POS receipts to bank deposits with <0.5% discrepancy; managed AP and supported quarterly tax documentation for CPA-led filings.
  • Processed bi-weekly payroll for 15+ employees with IRS-compliant tip reporting; trained 10+ staff on POS systems for a 30% efficiency gain.

Tien Ren Cultural & Educational Foundation

Lecturer & Event Organizer (2021 to present) · Assistant Lecturer (2019-2021)

Summer 2015 to now Indian Trail, NC
  • Delivered 30+ educational sessions to ~1,000 youth (ages 14-20).
  • Organized 3 annual volunteer events at Second Harvest Food Bank of Metrolina.
/ 07

# let's talk

I'm actively recruiting for winter 2026 & summer 2027 internships and full-time roles in quantitative research, equity research, actuarial, and data / risk analytics. If any of that sounds like a fit, I'd love to hear from you.